MVMT
A community effort focused on expanding transit options throughout Austin, Texas.
Project Lead & Service Designer @ Austin Transit Partnership | Collaborative Academic Project
Share student perspectives on mobility and the future integration of the Light Rail at the University of Texas at Austin.
THE OPPORTUNITY
Project Connect is a new transit plan for the city of Austin, Texas, introducing a Light Rail System and reinvigorating other transit services throughout. A significant stop along the route of the Light Rail is along Guadalupe St. on the campus of the University of Texas at Austin, providing me and my peers with the opportunity to illustrate the mobility journeys of the members of the UT community.
MVMT, the project borne out of the collaborative work with Project Connect, seeks to delve into the intricate narratives of UT community members, capturing the essence of their unique journeys and perspectives. MVMT aspires to foster a deeper understanding of our collective mobility patterns, igniting conversations and inspiring innovative solutions for the future of movement within our community and beyond.
THE PROLOGUE
Click to check out the official project website!
The goal of our investigation was to understand how students move, the why behind their transit decisions, and their attitudes toward the current transit environment.
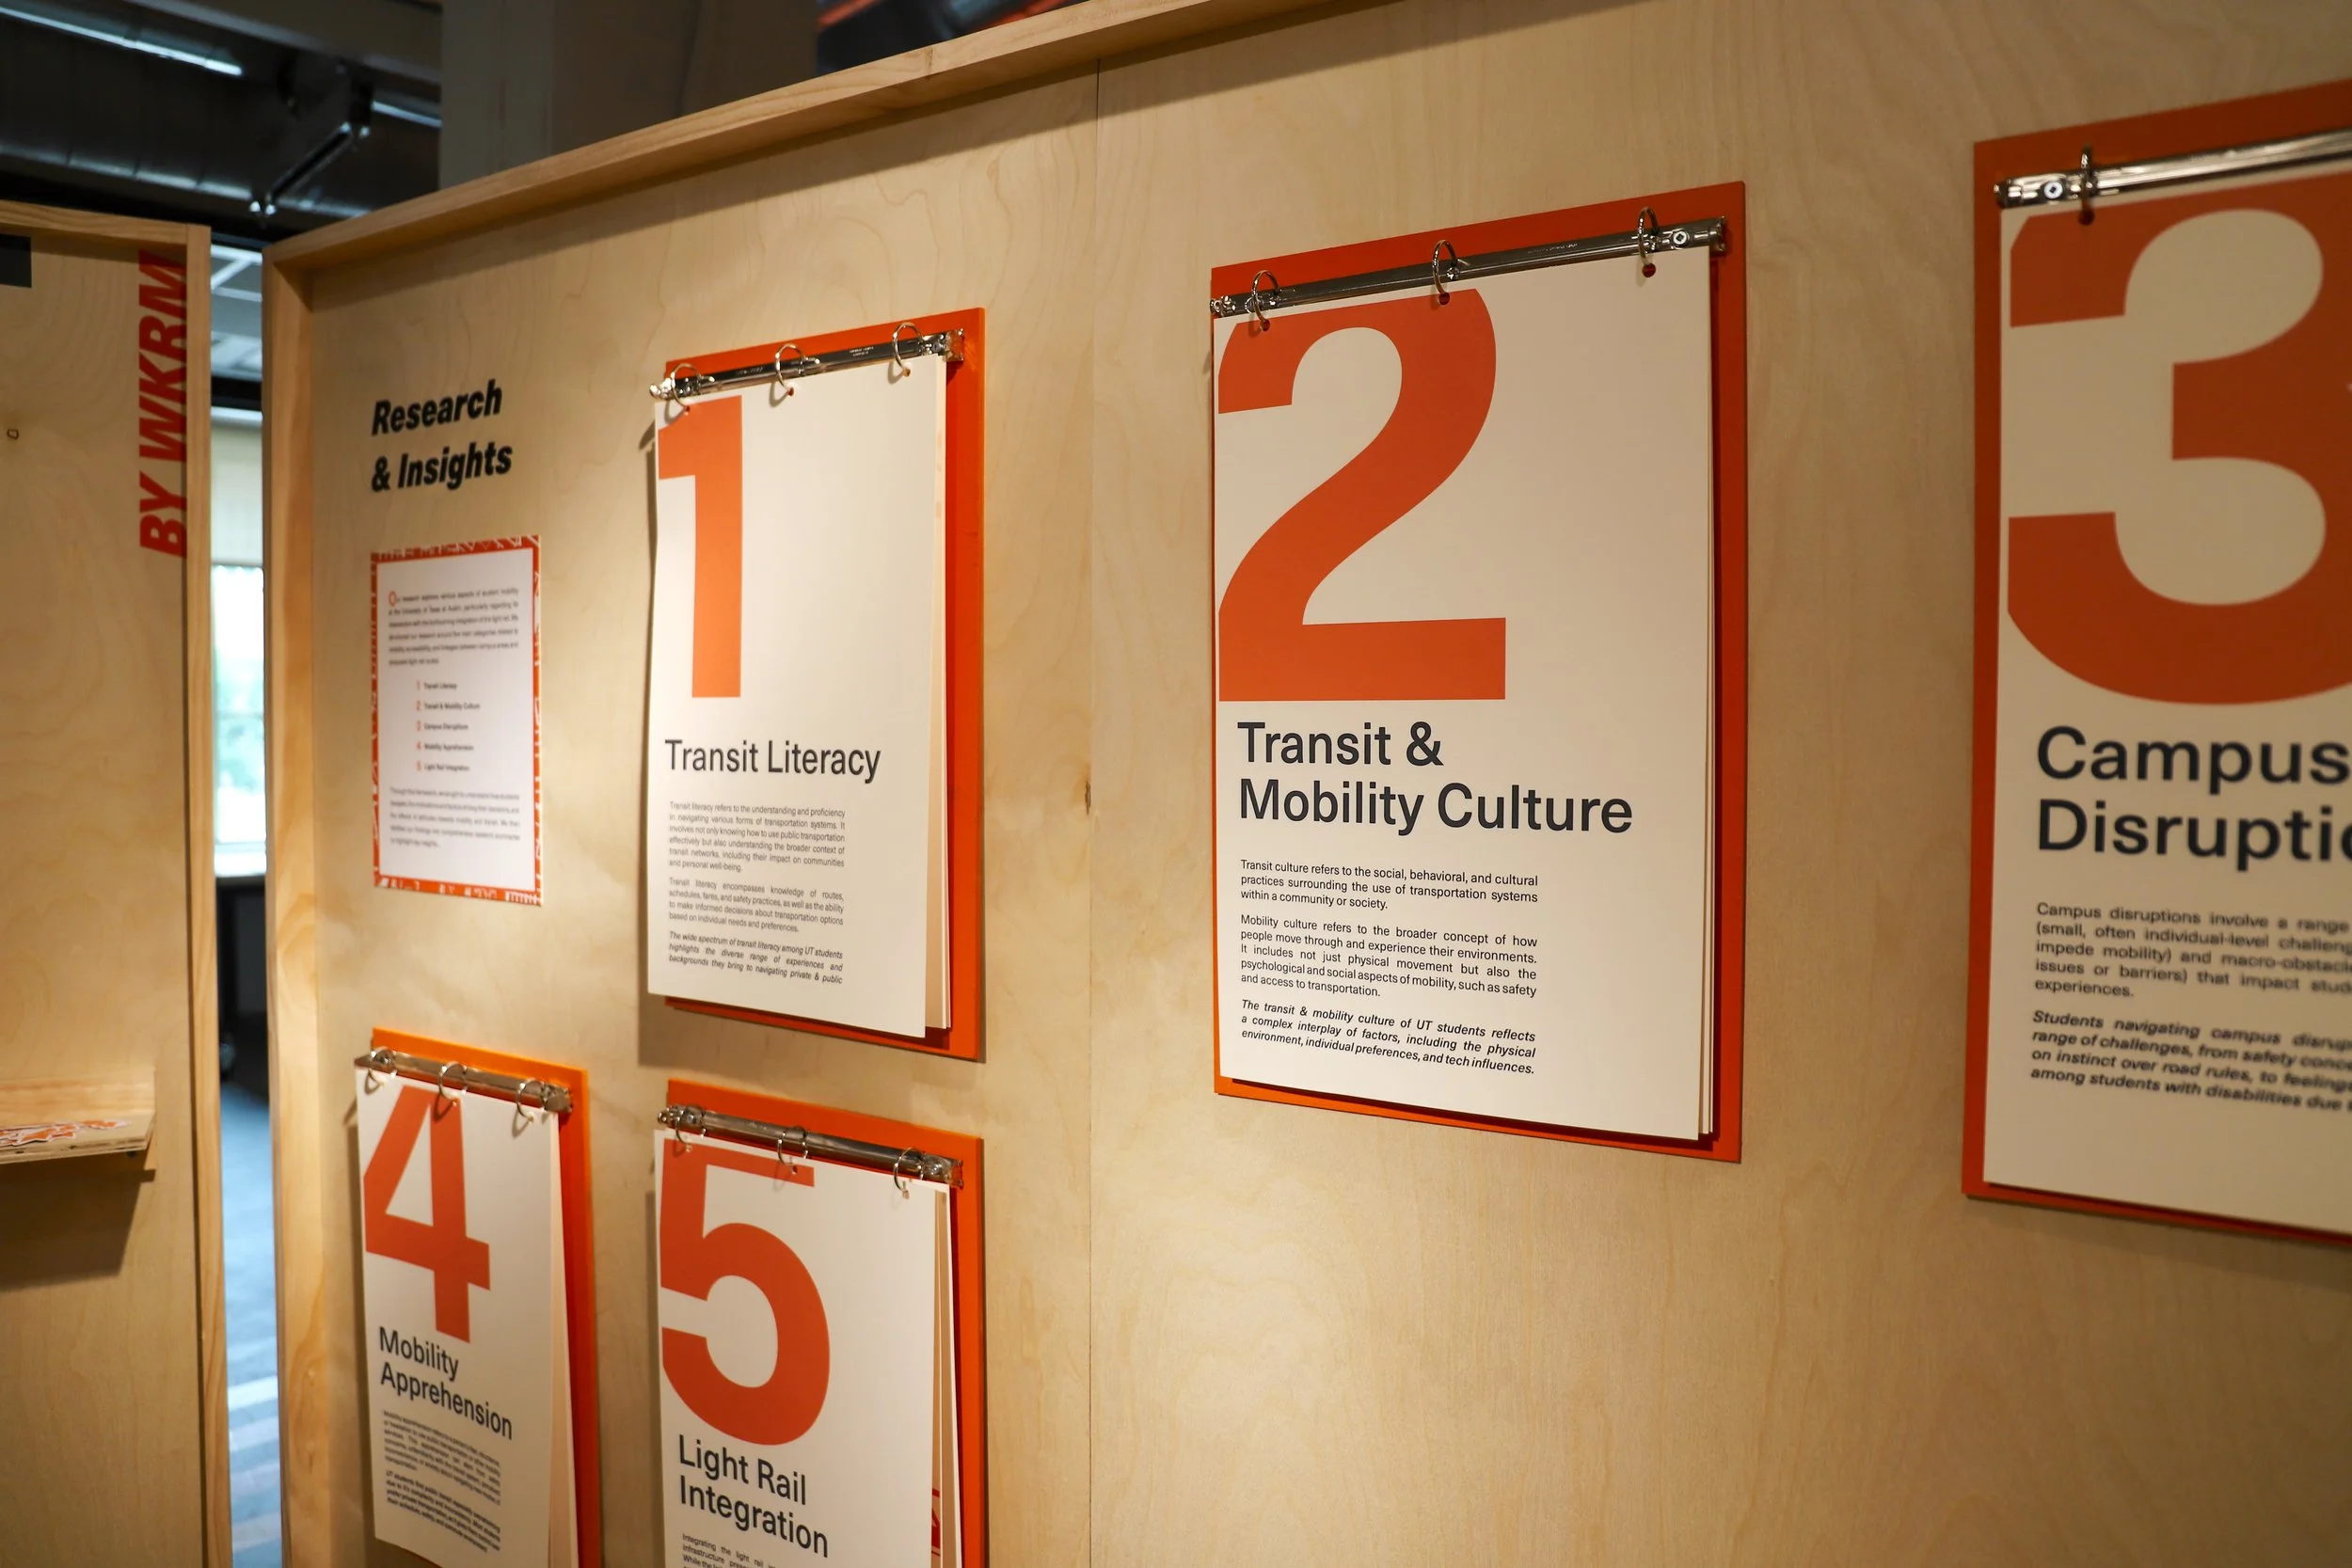
Our research was framed in five categories: Mobility Culture, Transit Literacy, Campus Disruptions, Mobility Apprehension, and Light Rail Integration, helping us understand student transit decision-making.
The mixed-methods research approach centered around “Navigator Types” the different kinds of classifications of students based on their primary modes of transportation.
We engaged with over 300 community members including students, faculty, and employees to understand their day-to-day transit experiences and beliefs.
THE RESEARCH
THE RESEARCH METHODOLOGY
10 observational field research sessions, 8 journey map exercises, 20 interviews, survey of 200 people, and social media studies
We developed insights through collecting quantitative and qualitative data on student mobility experiences.
THE INSIGHTS
We synthesized our research data into the Factors Framework and the Navigator Types chart. The framework outlines the different elements influencing a Navigator's journey as they maneuver their environments. The factors include: Accessibility, Security, Comfort, Identity, Community. Each of the factors plays a role in helping pedestrians build Knowledge about how to get around campus and contributes to their sense of Agency.
The Navigator Types chart takes a deep dive into each Navigator, including their needs, challenges, expectations, etc. These outcomes combined helped us understand the how and the why of transit decisions and experiences.
THE ANALYSIS METHODOLOGY
Affinity Mapping, Quick Concept Ideation, Stakeholder Mapping, Persona Profiling, Problem Tree Analysis, Thumbnail Sketching, Importance/Difficulty Matrix
We devised a system of concepts that make the campus environment more useful and build better mobility culture.
THE SOLUTION
Our concepts tackled reinvigorating the environment to help community members orient themselves better, feel more confident about their transit choices and decisions, and gain a better understanding of how they can be mobile.
These concepts were ideated and prototyped using insights from our research, intended to be employed by our clients to help promote ease of integration of the Light Rail System.

The Live Data App is a user-friendly platform empowering pedestrians to report sidewalk disruptions impacting individuals with disabilities and pedestrians at large. Additionally, it offers insights into bus routes, rental bikes, landmarks, and more information about public transit, along with user-generated trip suggestions.

The Live Data App is a user-friendly platform empowering pedestrians to report sidewalk disruptions impacting individuals with disabilities and pedestrians at large. Additionally, it offers insights into bus routes, rental bikes, landmarks, and more information about public transit, along with user-generated trip suggestions.

The Navigator Types Chart describes the general expectations, needs, and experiences of people as they navigate their surroundings. This is a detailed tool for our clients to use during solution implementation.

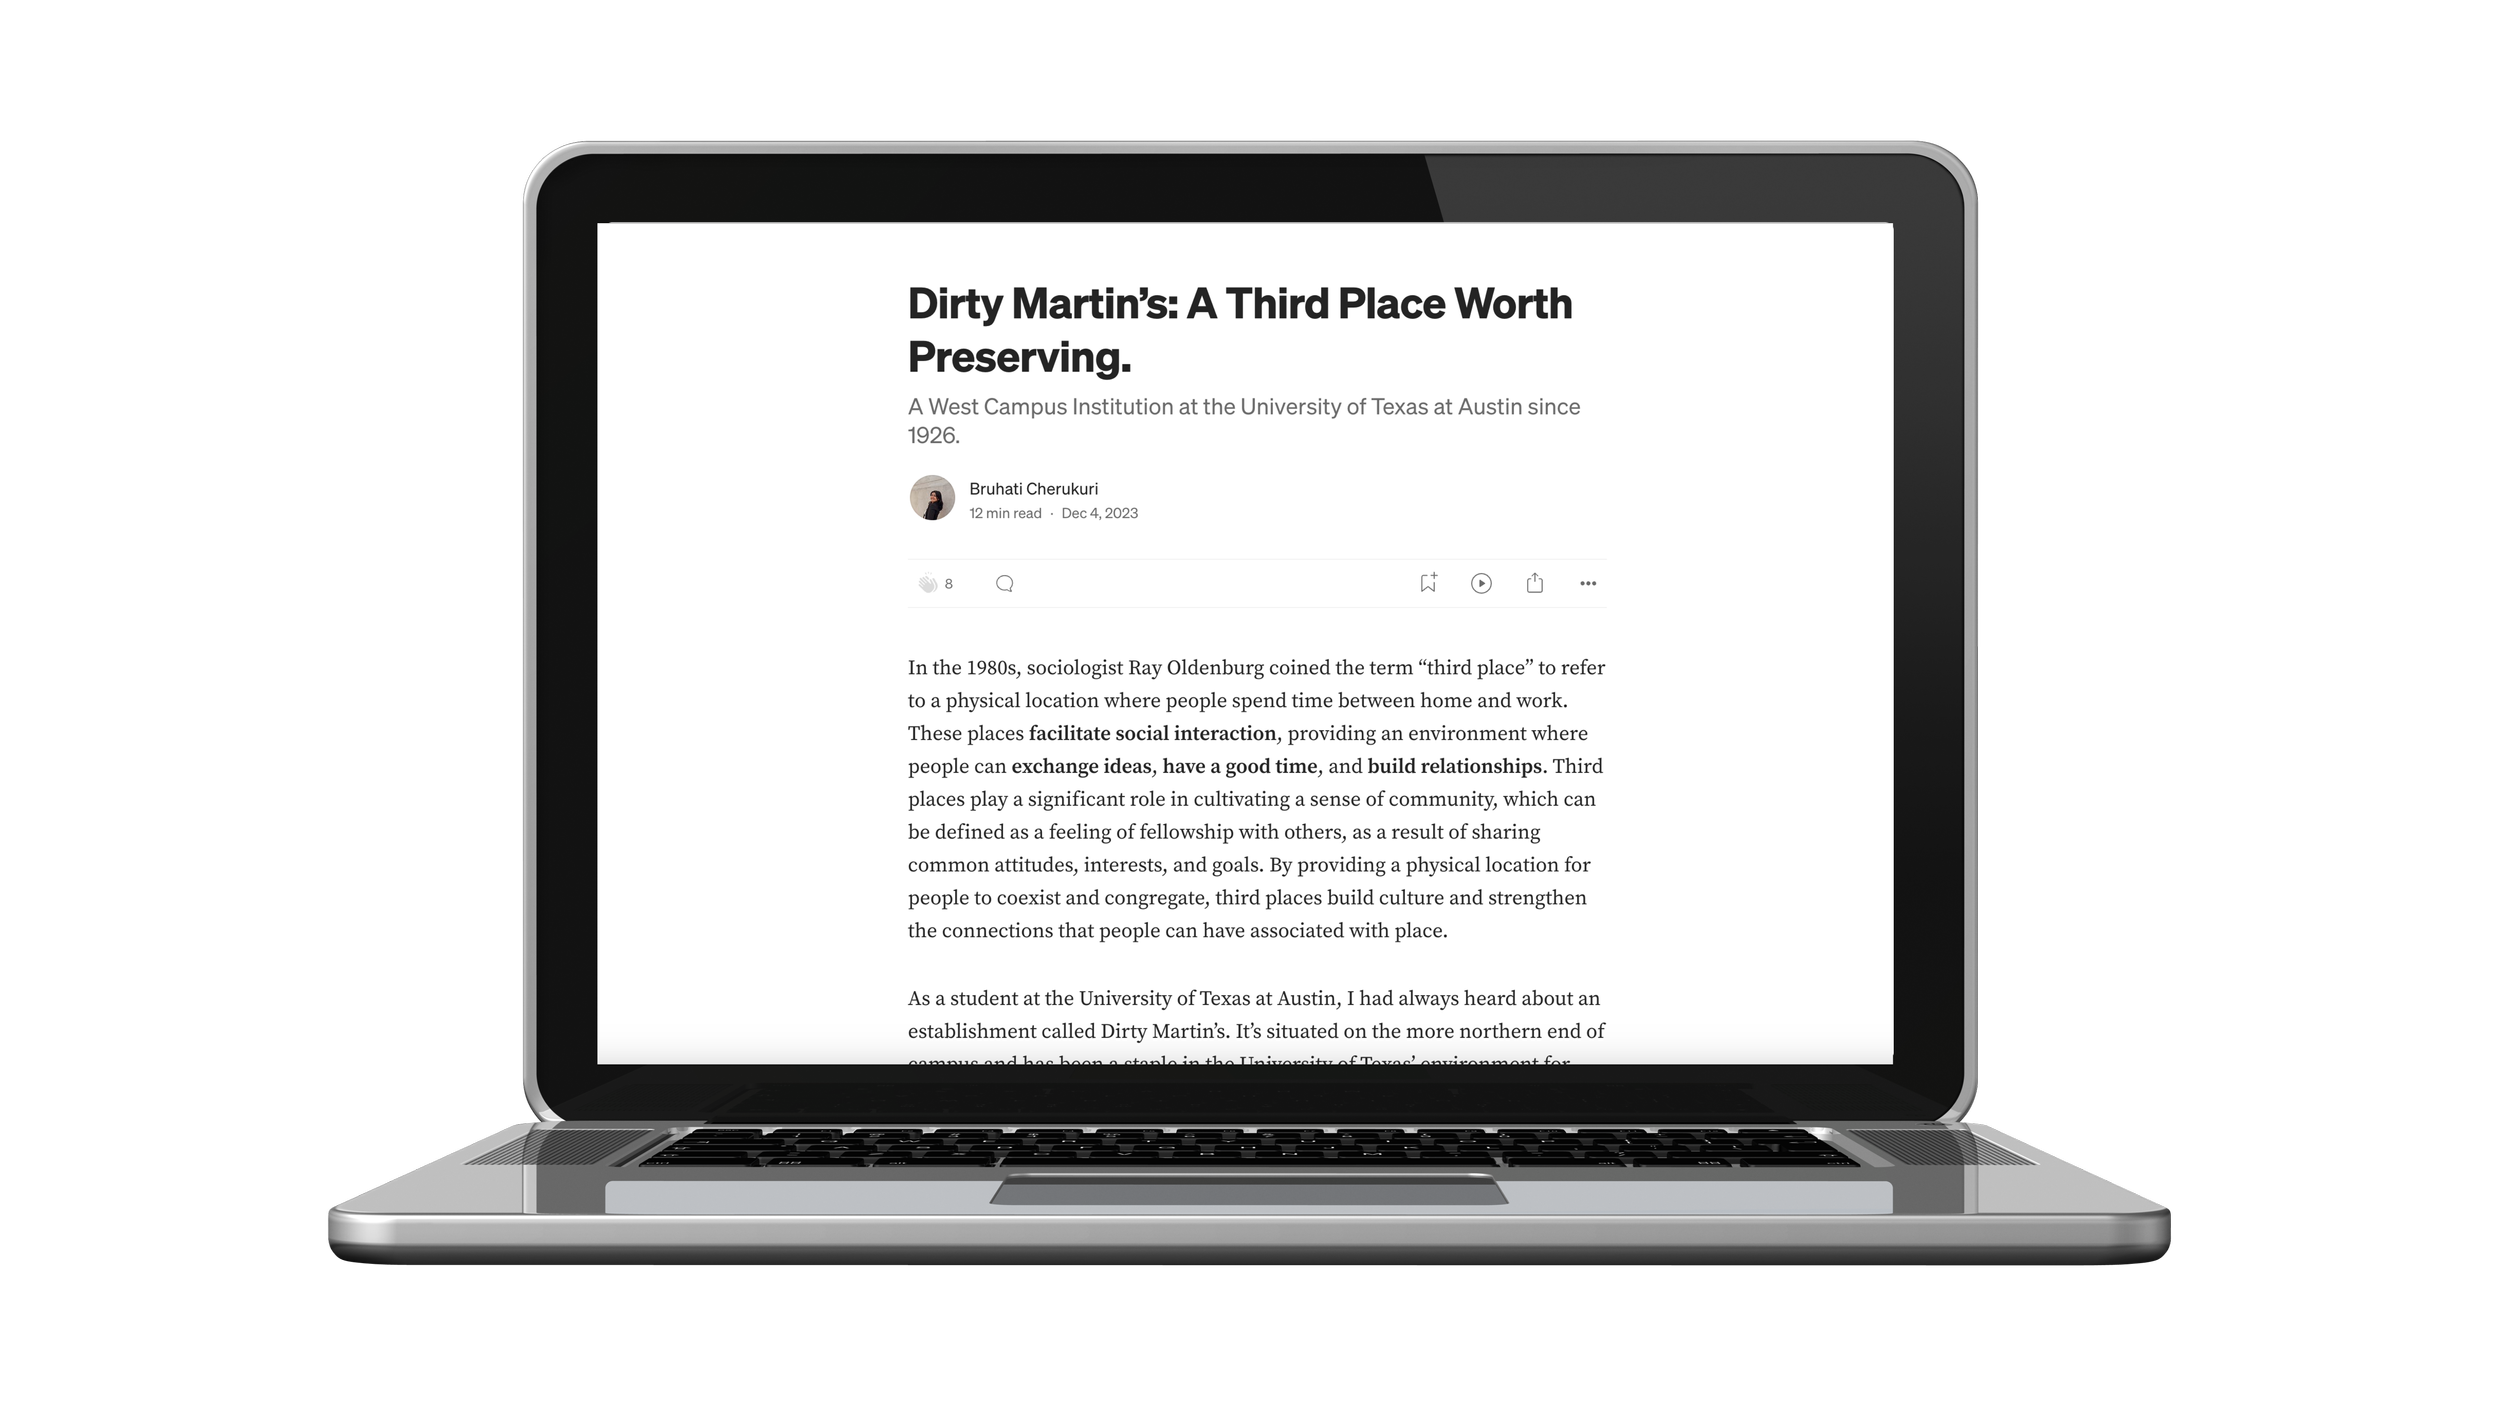
The most impactful outcome of this project was the preservation of Dirty Martin's - a UT Austin campus institution since 1926. Click to read my article outlining the cultural significance of the establishment to the UT Austin community.

The Mobility Markers concept is a system of environmental graphics that support Navigators orienting themselves in an environment. These markers direct, inform, signal, and support mobility.

We filmed and compiled videos of daily commutes that students take on campus to show how they get around and what they encounter depending on their mode of transportation. Click to view the videos!

Mobility Waystations are augmented areas that provide Navigators with the opportunity to rest, orient themselves, and inform themselves of their surroundings. These Waystations can also offer scooter/bike parking, benches, directional maps, and other amenities that support walking, waiting, resting, and riding.

The Transit Literacy Wiki is a digital platform that offers Navigators a quiz that describes the best possible transit options that are available to them to get to a certain destination, the costs associated, and how to go about accessing these transit options.

The Transit Literacy Wiki is a digital platform that offers Navigators a quiz that describes the best possible transit options that are available to them to get to a certain destination, the costs associated, and how to go about accessing these transit options.

The Transit Literacy Wiki is a digital platform that offers Navigators a quiz that describes the best possible transit options that are available to them to get to a certain destination, the costs associated, and how to go about accessing these transit options.

The Mobility Modes Cards are a trading card deck that aims to spread the idea of embracing mobility and build students’ knowledge and comfort levels with new modes of movement from a student's entrance into the university space.

The Mobility Modes Cards are a trading card deck that aims to spread the idea of embracing mobility and build students’ knowledge and comfort levels with new modes of movement from a student's entrance into the university space.

Mobility Waystations are augmented areas that provide Navigators with the opportunity to rest, orient themselves, and inform themselves of their surroundings. These Waystations can also offer scooter/bike parking, benches, directional maps, and other amenities that support walking, waiting, resting, and riding.

A comprehensive website entailing all of our research insights, solutions, and recommendations. Click to explore!

The Mobility Markers concept is a system of environmental graphics that support Navigators orienting themselves in an environment. These markers direct, inform, signal, and support mobility.
Clients were able to make more student-focused decisions and develop more applicable solutions.
THE OUTCOME
Our goal with this project was to give a glimpse into our lives as students at the University of Texas. Utilizing diverse research methods, we delivered garnered nuanced insights into students' daily experiences, challenges, and sentiments to our clients. This comprehensive perspective informs decision-making, particularly regarding proposed changes, ensuring the Austin Transit Partnership remains responsive and considerate of the dynamic needs within the UT community as they work to revamp the transit experience in the city of Austin.
We translated our year-long research study into a physical exhibition that was put on display for UT & Austin community members.
Drawing inspiration from children's museums and playgrounds, the exhibition component was all about translating months' worth of research and service design concepts into an engaging and interactive display built from scratch.
ROLES & RESPONSIBILITIES
Guided design process and facilitated conversations between peers and clients. Developed activities and led decision-making processes.
Leadership & Group Facilitator
Graphic Design
Developed project branding guide and rendered environmental graphics and other design solutions.
User Research
Conducted extensive quantitative and qualitative research with student populations and led analysis phase.
Conceptualized project exhibit, planned and executed construction of display.
Industrial & Exhibition Design
Wireframed and prototyped app solutions and web resources to improve student mobility.
UI Design
Presentation & Communication
Lead presentations and communication with clients and general audiences to effectively communicate project content.
TOOLS
Design Thinking, Illustrator, Photoshop, InDesign, Miro, Figma, Premier Pro, Rhino 3D, Medium, Canva, Woodshop tools
TIMELINE
36 weeks


